One membership. Web and Chrome extension. 14 days free.
Find Cash-Flowing Deals
Before Others Run the Numbers.
DoorHunter continuously ingests live on-market listings and models 30-year pro-formas calibrated to your custom buy box: mortgage rates, down payment, local property tax, capex, and target returns.
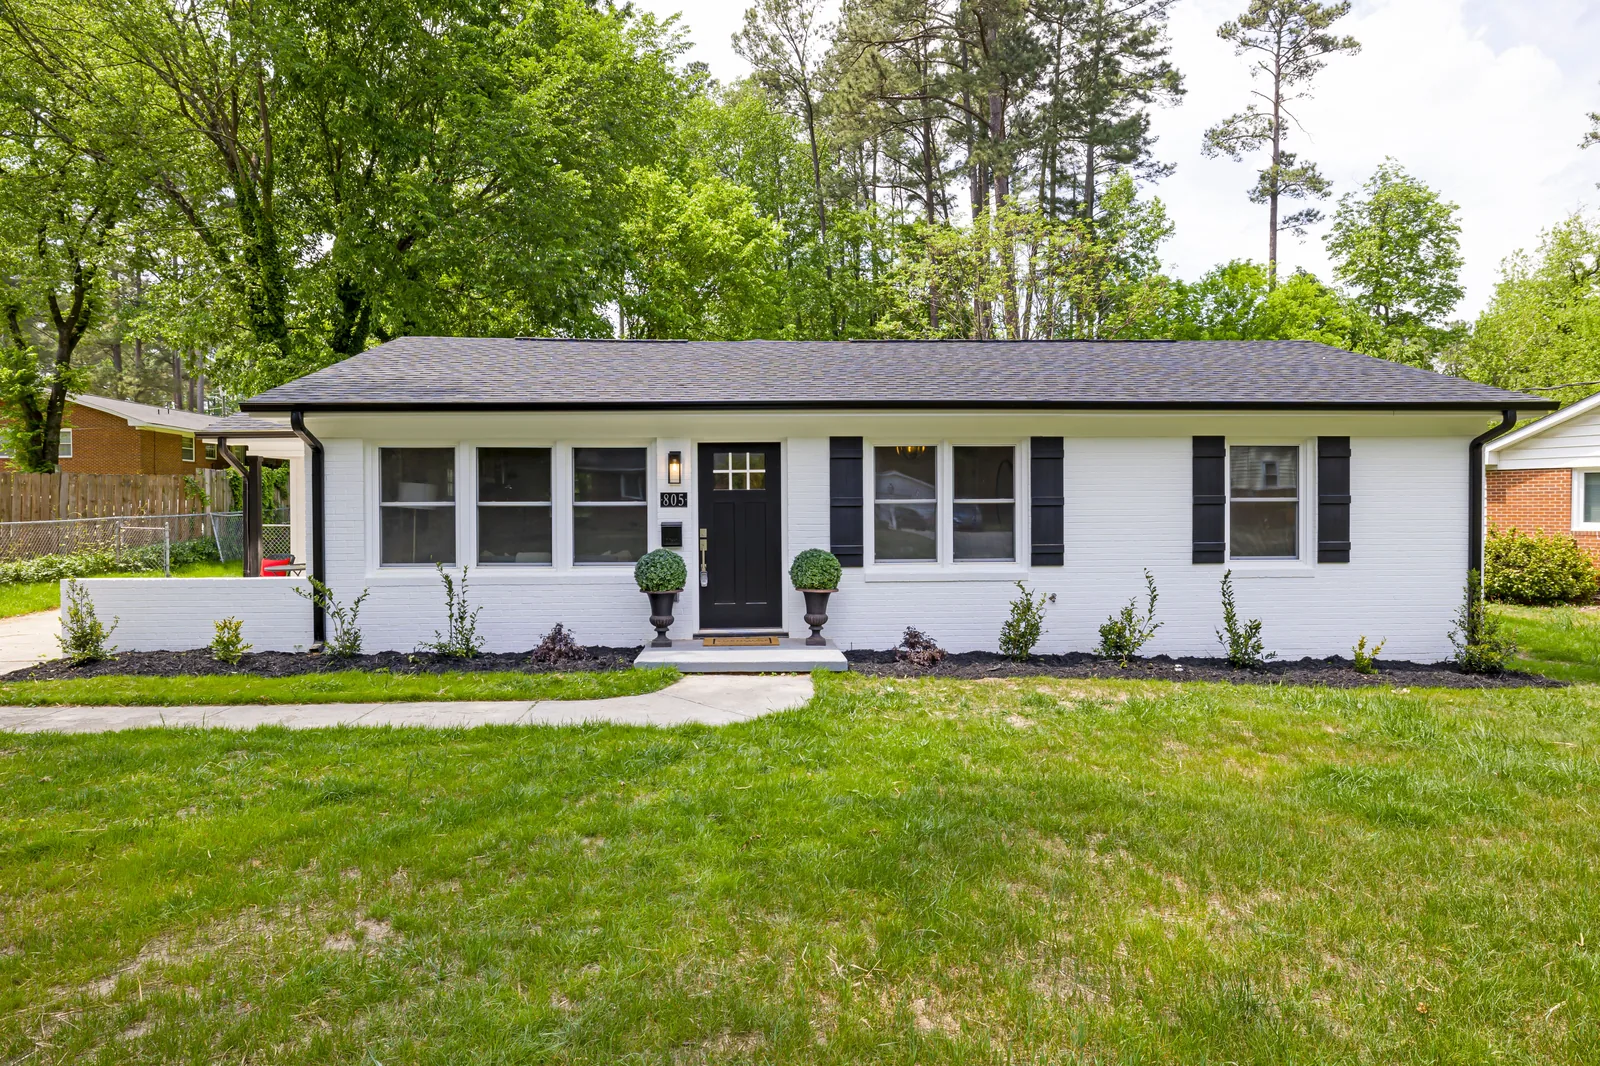
805 Oakwood Drive
Dallas, TX 75206 • 3 Bed, 2 Bath • 1,850 sqft
0
Properties Indexed30-Year
Pro-Forma Cash Flow Projections2
US Markets Monitored< 1s
Automated Underwriting LatencySupported Markets & Live Submarkets
DoorHunter monitors 2 supported markets nationwide. Select a market to explore active deals, cap rate distributions, and local rental yields.
Engineered for Serious Rental Investors
DoorHunter replaces slow, manual Excel spreadsheets with continuous listing ingestion and instantaneous 30-year pro-formas.
Comprehensive Financial Pro-Formas
Every property is modeled with full 30-year amortization, county-specific property tax assessments, hazard insurance rates, property management fees, and structural capex reserves.
Spatial Deal Discovery
Scan thousands of properties across metropolitan regions with interactive map overlays color-coded by cash flow, cap rate, and price-to-rent yield ratios.
Verified Comparable Sales
Underwrite with confidence using closed, normally marketed sales bounded by strict distance and recency weighting.
2408 Live Oak St
0.2 mi • Sold 45d ago • 1,820 sqft
1812 Pecan Grove Rd
0.5 mi • Sold 90d ago • 1,910 sqft
Calibrated Buy Box Automation
Define multiple investment strategies: cash-flow yield plays, BRRRR equity targets, or appreciation corridors. DoorHunter highlights properties meeting your criteria automatically.
Analyze 100s of Properties All at Once
Define your custom Buy Box to filter entire metropolitan markets in seconds. Watch cash flows and cap rates update across every property marker simultaneously.
Market Buy Box Parameters
Adjust criteria to see live qualifying deals update across the metropolitan area.
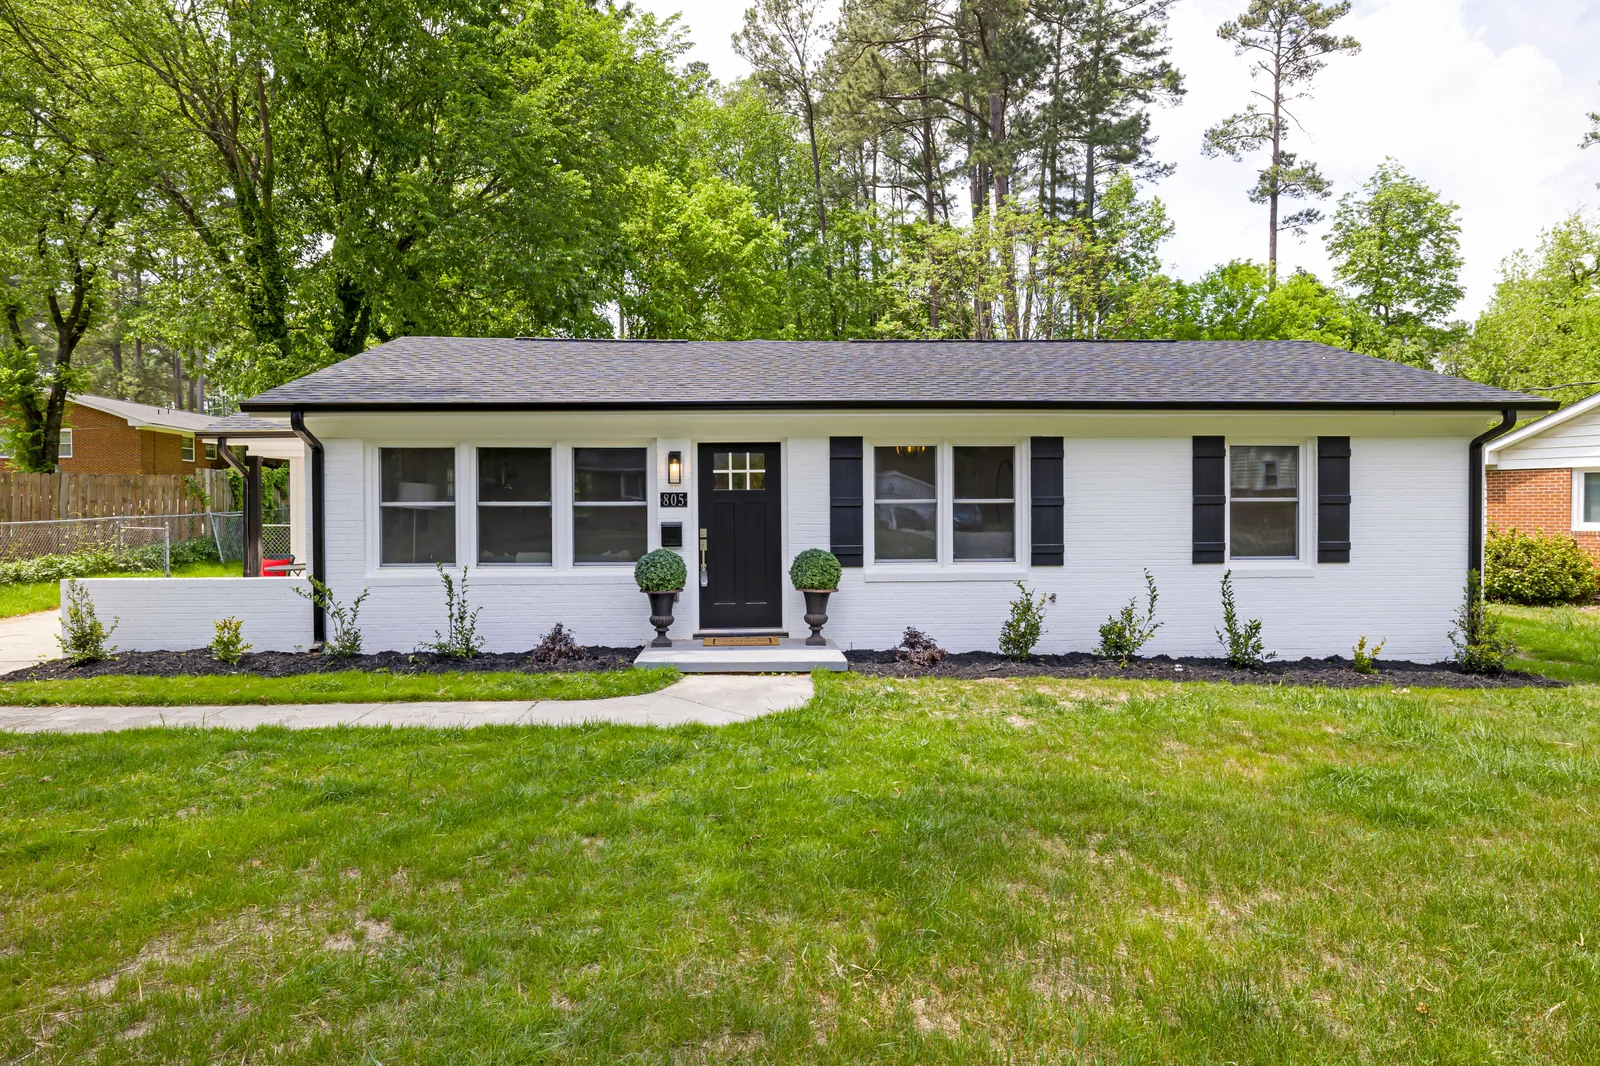
805 Oakwood Drive
Meets Buy BoxBouldin Creek · 3b / 2ba · 1,850 sqft
Interactive Pro-Forma Sandbox
Or perform in-depth underwriting on a single property. Fine-tune acquisition pricing, market rent, mortgage financing, and granular operating reserve assumptions.
805 Oakwood Drive
Austin, TX · Bouldin Creek · 3 Beds, 2 Baths · 1,850 sqft
Underwriting Inputs
Adjust deal terms to observe real-time impact on cash flow, debt service, and returns.
Operating Reserve Assumptions
Live Pro-Forma Output
One membership for your property research.
Search deals, compare properties, and test your investment assumptions on the web and in the Chrome extension.
$10.00/ month
14 days free. No credit card required.
Start free trialWhat happens when my trial expires?
Investor tools lock until you subscribe. Your buy boxes and saved properties remain, and account settings, billing, and support stay available.
When will I be charged?
The trial starts only when you choose to start it. No card is required. If you subscribe during your trial, your first charge is on the trial end date. Membership then renews monthly.
How do I cancel?
Cancel renewal in Subscription & billing. Paid access continues through the paid period.
Which markets are supported?
See the supported markets section above for current coverage. Availability varies by market and listing.
What if I already have an account?
Accounts created before the membership launch cutoff keep the launch feature set free. Future premium features may have separate pricing.